Local Authority Political Analysis (LAPA) Report
LAPA provides live insights and a view and analysis of the political landscape across Local Government. Data is provided from our Local Government Research Team and updates are made continuously.
Live Selectable Political Analysis
Individual Council Political Analysis Tool. Filter by Council Control, Region or Party
Live Dynamic Political Analysis Control Panel
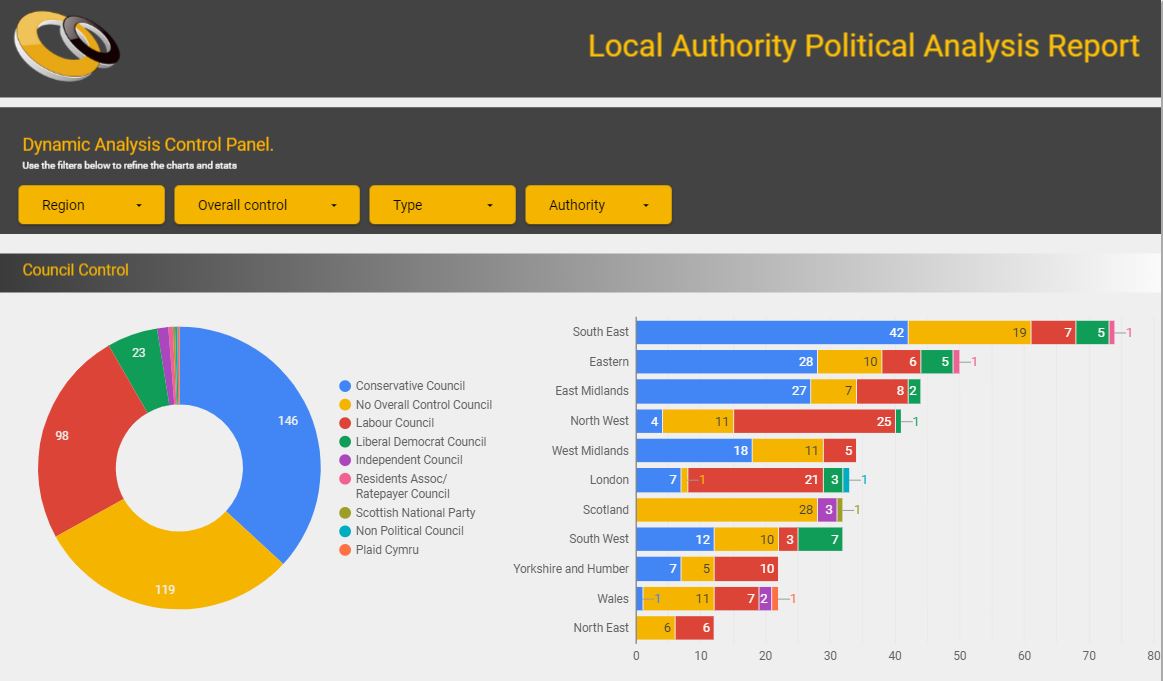
Live and Dynamic Graphical Analysis of Council Political Control and Number of Seats by Party, Region and Type. Including historical political party analysis.
The subscription includes continuous live access with dynamic filters and views. Order full access here or contact us to arrange a presentation of the subscription.

Get access to the full live political report for all UK Councils and Seats
Contact UsIf you would like to discuss this report or commission your own
Live Selectable Political Analysis
Screenshot showing the Individual Council Political Analysis Tool. The subscription provides a live filter by Council Control, Region or Party. Clickable field headers and sliders and drop down options to sort and analyse the data as required.

Live Dynamic Political Analysis Control Panel
The control panel provides dynamic filters by Political Party, Region, Council Type and Council Name which generate various graphical visualisations and charts. An extract of which can be seen in the screenshot below

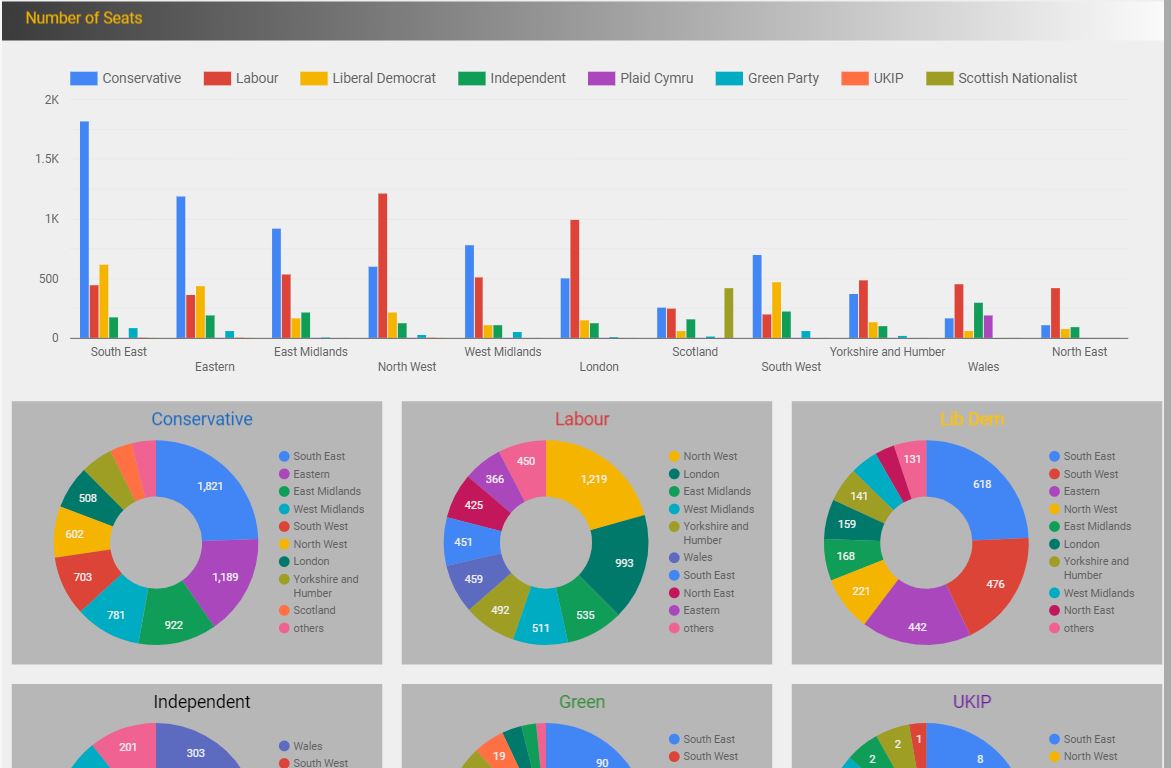
The control panel shows detailed analysis and visualisations around the number of Seats by Political Party and Geography. Screenshot below

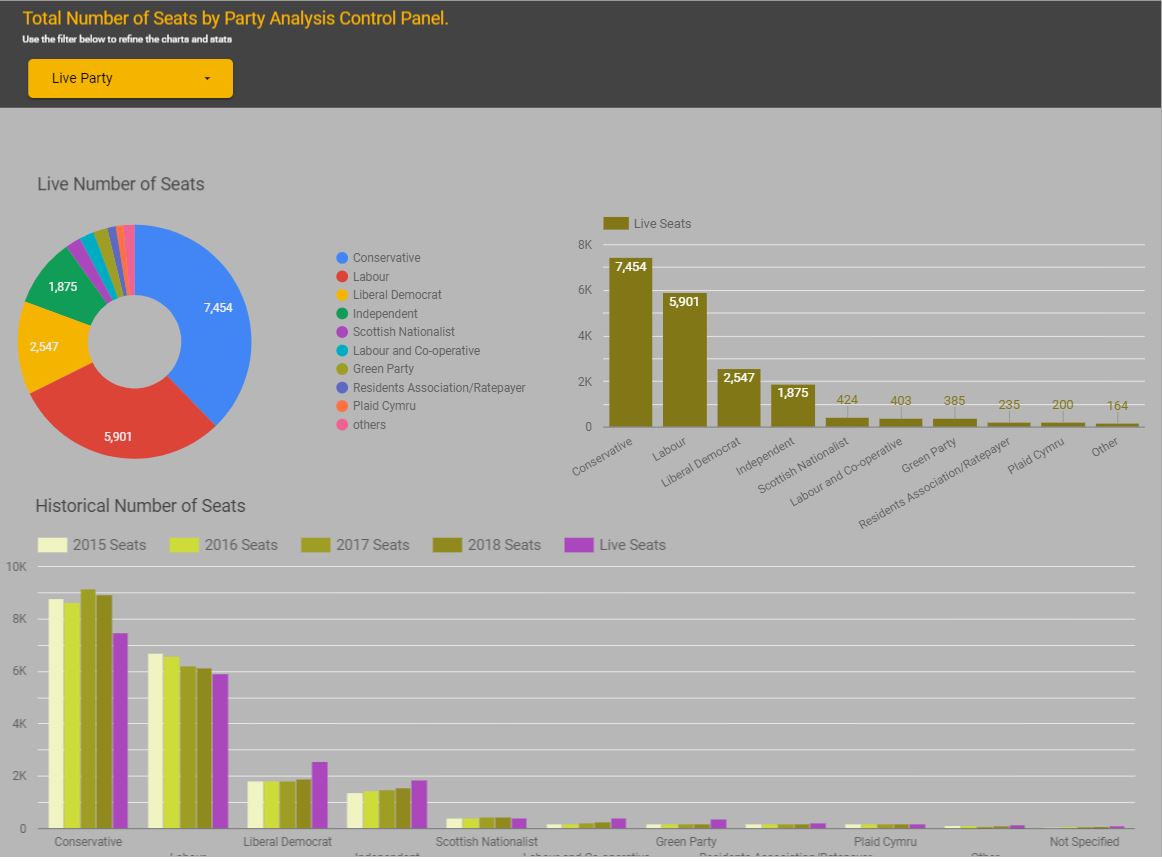
In addition to the Seat analysis detailed above, additional dynamic filters and visualisations are available that include both analysis of the live number of seats and historical comparisons. Screenshot below

